Phone services have seen an extension of the upper limit of audio frequency from the traditional 3.4kHz of PSTN to 7.5kHz for wideband. VoLTE and 4G services using AMR can be wideband. OTT or desktop applications can be 12kHz or up to super-wideband. Conferencing services may even be full-band.
SPEECH TRANSMISSION BANDWIDTHS
How do you know whether the signal you are receiving is narrowband, wideband or beyond?
SPEECH TRANSMISSION BANDWIDTH SCENARIOS
A variety of speech transmission bandwidth combinations are possible. The least desirable scenario is where a signal is constrained to narrowband in the network but the handset continues with a wideband presentation.
You can look at the Waveform View in the Results Analyser of MultiDSLA and see where the degraded speech file rolls off. But in thousands of measurements recorded in a VoLTE drive test you need the data to see where it drops to narrowband and whether it recovers.
MultiDSLA v5.2.0 includes a Performance Examiner feature called Bandwidth ID. The upper cutoff frequency of the speech is identified in the waveform view as well as recorded amongst the results in the database.

Unveiling Bandwidth Compatibility: Narrowband vs. Wideband Signal Reception
In the waveform view above, the upper cutoff frequency of the degraded file (red) is 5.8kHz. This tells you whether you received narrowband or wideband – wideband in this case. But we also need to know the bandwidth limit of the receiving device. If we are expecting a wideband signal but only measure narrowband that could be due to a constriction on bandwidth in the transmission path or in the actual receiving device. Bandwidth ID identifies the high frequency limit of the receiving device. The channel being measured here has a limit of 6.3kHz. The 32k sample rate file that was played out has an upper cutoff frequency of 13.9kHz.
Now you can see whether the narrowband signal is in a narrowband or wideband receiving channel.
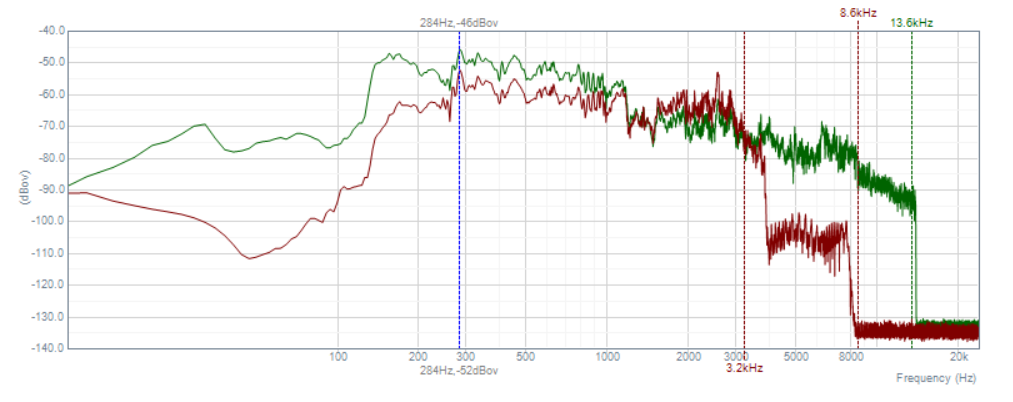
In this example, a wideband smartphone is receiving a narrowband signal after a super-wideband signal was presented at the microphone input of the sending end. The 3.2kHz upper cutoff frequency is identified in a channel showing speech-like signals up to 8.6kHz. These artefacts are most likely due to inadequate reconstruction filters as they show predominantly in the louder speech segments.

The selected segment of loud speech shows high energy artefacts beyond 8kHz. The Bandwidth ID results appear in the Results Analyser treeview and are recorded in the database.

Now it is easy to see where that VoLTE transmission went to narrowband and where it returned to wideband.
The example below shows how the received speech bandwidth in a Skype call varies when a data file is transmitted over the same Wi-Fi network.

SKYPE CALL BANDWIDTH VARIATION
The graphs below show how speech bandwidth, POLQA SWB MOS estimate and delay varied during a series of speech quality measurements with a female and a male speaker.


In both cases, the file transmission began during the seventh speech quality measurement. The reduction in bandwidth occurs as the codec data rate is reduced. A small increase in delay is evident, reflecting the jitter buffer extension due to an increase in jitter.
Contact Opale Systems or your distributor for more information.